
What Project Opposition Really Costs Developers Today

Project opposition costs developers real money across three buckets: direct expenses (consulting, mitigation, communications), indirect costs (delays, sunk investment, higher financing costs), and opportunity costs (lost capacity, eroded pipeline value). Canceled solar projects carry average sunk costs near $2 million, while canceled wind projects average roughly $7.5 million. Delays run about $200,000 per megawatt. Every month of opposition-driven delay chips away at project NPV and raises the cost of capital lenders will demand.
Direct: consultants, redesign, mitigation payments, communications
Indirect: schedule slippage, sunk costs, higher WACC, insurance friction
Opportunity: lost power purchase agreements, foregone capacity, damaged pipeline
Key figure: One documented case in the IHRB report put unmanaged conflict losses at $200 million over ten years for a single developer, with 3.3 gigawatts of capacity left undeveloped.
Key Takeaways
Project opposition typically costs developers far more through delays and sunk investment than through prevention, making early engagement the financially rational choice.
Point | Details |
Sunk costs vary by technology | Canceled projects average about $2 million for solar and $7.5 million for wind. |
Delays are expensive per megawatt | Opposition-driven delays average roughly $200,000 per MW, dwarfing typical engagement budgets. |
Transparency prevents fast-forming opposition | Naming tenants and owners early is the most reliable single mitigator identified in data center cancellations. |
Track costs across departments | CFOs should aggregate delay-days, sunk costs, and engagement spend into one dashboard to see the real risk profile. |
Amauta builds prevention into campaigns | Amautapublicaffairs runs community engagement, media relations, and advocacy as one coordinated strategy to reduce these costs before they escalate. |
Table of Contents
What Does Project Opposition Cost Mean for Your Budget?
The financial implications of project opposition don’t show up as one line item. They scatter across legal-adjacent advisory, engineering, communications, and finance, which is exactly why most organizations underestimate them until a lender asks hard questions.
Direct costs are the ones a project team notices first: public-affairs consultants, community liaison staff, mitigation payments (noise buffers, viewshed screening, traffic studies), and redesign work triggered by pushback. A single contested hearing can force a redesign that costs more than the original engagement budget would have.
Indirect costs are quieter but larger. They include:
Permitting delays that push commercial operation dates back months or years
Sunk costs on land options, interconnection studies, and design work if a project dies
Higher financing costs, since lenders price opposition risk into the weighted average cost of capital
Insurance and underwriting friction, as insurers factor community risk into premiums
Opportunity costs hit the portfolio level. A developer juggling multiple sites may lose a signed power purchase agreement because a delayed project can’t meet a delivery deadline, or watch its broader pipeline slow as investors grow wary of a track record marred by cancellations.
How Much Does Project Opposition Cost on Average?
Industry benchmarks give practitioners a starting point for risk budgeting rather than a guarantee. The Lawrence Berkeley National Laboratory developer survey remains the most cited source for these figures, and they hold up well against the broader body of reporting on renewable-energy opposition.
Average sunk costs for canceled projects land near $2 million for solar and $7.5 million for wind, reflecting wind’s longer development timelines and larger capital commitments before a cancellation decision gets made. Delay costs average about $200,000 per megawatt, a figure that scales quickly on utility-size projects.
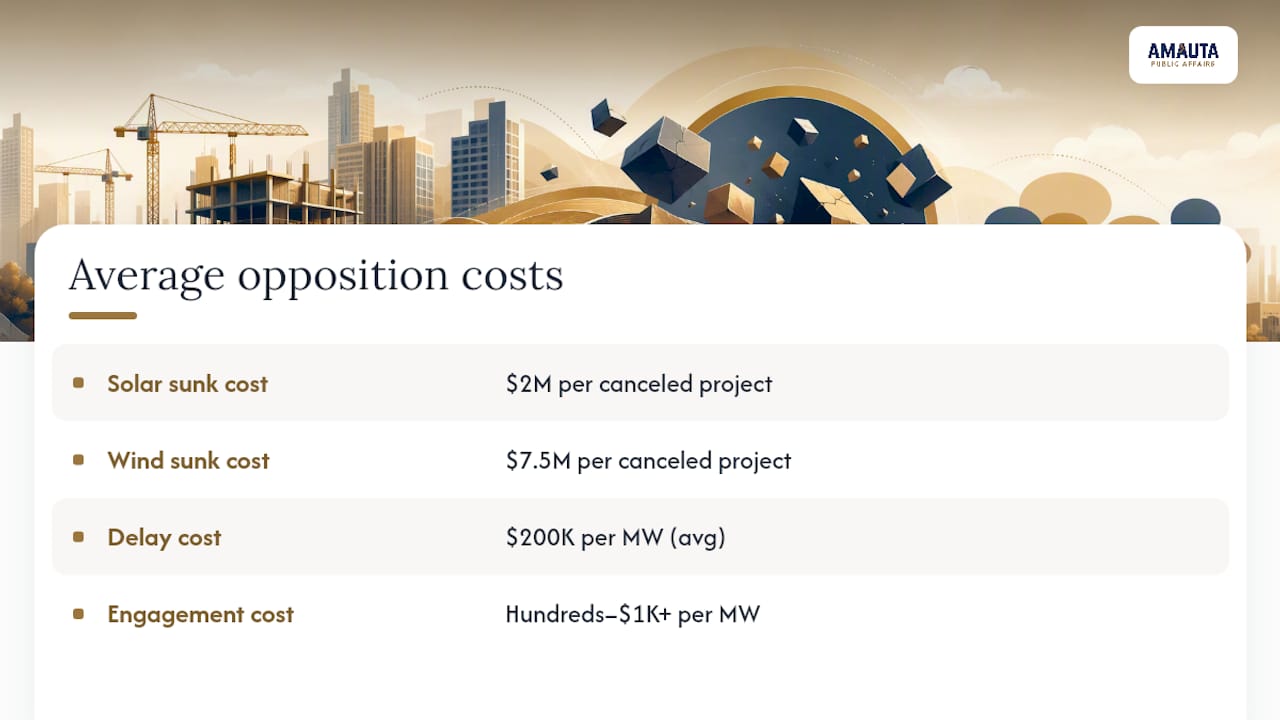
Community engagement spend, by contrast, runs far leaner, at hundreds to a bit over a thousand dollars per megawatt for solar and wind. That gap between what prevention costs and what delay or cancellation costs is the single most persuasive number in this entire discussion. Spending on the low end to avoid landing on the high end is not a marginal decision. It’s the core financial logic of engagement budgeting.
Why Does Opposition Form, and When?
Opposition rarely erupts at random. It tends to follow predictable triggers, and understanding the sequence helps teams decide where to spend early rather than reactively.
Transparency failures come first. Undisclosed ownership structures and NDAs around land options consistently accelerate organizing. According to the Route Fifty summary of Carbon Direct’s data center findings, lack of transparency was the most common reason projects were abandoned between January 2024 and May 2026, a period in which at least 46 AI data center projects worth $170 billion were delayed or canceled.
Concrete local concerns follow close behind. Visual impact, agricultural land conversion, and conflicts with existing zoning ordinances give opposition something specific to organize around.
A vocal minority often drives the narrative. Developer survey respondents frequently describe opposition as originating from a small, organized group rather than broad community sentiment, sometimes amplified by outside advocacy organizations with no direct stake in the project.
Predicting exactly which project will draw opposition remains genuinely difficult. That unpredictability is itself an argument for treating early transparency and stakeholder mapping as standard practice rather than a response reserved for projects that already look troubled.
How Do You Track the Hidden Bill Across Departments?
The costs of opposition rarely appear on a single budget line, which is precisely why so many finance teams undercount them. The IHRB’s CFO brief argues that making these costs visible requires pulling data from legal, engineering, communications, and finance into one taxonomy.
Track delay-days as a standing metric, not a one-off note in a status report
Log sunk cost to date against original site-control investment
Compare engagement spend per megawatt against actual delay incidence
Flag insurance and financing terms that shift once opposition surfaces publicly
A counterfactual valuation, modeling what the project would be worth without opposition, against its actual trajectory, gives lenders and boards a clean number for the value early engagement protects. Delay-days carrying a cost multiplier flow directly into interest-during-construction calculations and debt-service coverage ratios, meaning a modest delay can tighten covenant headroom more than most finance teams expect.
Pro Tip: Assign every delay-day a dollar value up front, before a hearing gets contentious. Once your finance team can name that number in a meeting, engagement spend stops looking discretionary and starts looking like insurance.
What Prevention Tactics Actually Reduce Opposition Costs?
Prevention works best when it’s sequenced to project timing rather than deployed all at once. Here’s a rough order of operations:
Map stakeholders before you file paperwork. Know who the vocal minority will likely be and what they care about before the first hearing, not after.
Offer community benefits before they’re demanded. Negotiated benefit packages read very differently when offered proactively versus conceded under pressure.
Bring in third-party advocates or neutral intermediaries when a project’s own voice lacks credibility with a skeptical community, particularly for energy and infrastructure projects facing organized resistance.
Set a clear escalation threshold. Decide in advance what delay duration or cost triggers an intensified engagement campaign versus simply absorbing slower permitting.
Budgeting guidance from government affairs planning research suggests treating engagement spend as a percentage of early-stage site-control costs rather than a fixed dollar figure, since project scale should drive the number.
Pro Tip: Reallocating even a small share of contingency budget into early engagement is often NPV-positive, because it lowers the probability of the far more expensive delay scenario.
Sample Budget Worksheet for Estimating Opposition Costs
A quick worksheet turns these benchmarks into a working number for your project. Start with a per-megawatt line for engagement ($700 to $1,100 depending on technology), add a contingency line sized to your delay-risk tolerance, and stress-test it against the $200,000-per-megawatt delay benchmark.
Line 1: Engagement and advocacy spend (per MW, by technology type)
Line 2: Contingency for redesign or mitigation payments
Line 3: Delay contingency, modeled against months of potential slippage
Line 4: Sensitivity check, since even a two-month delay on a large project can move NPV by a meaningful margin given financing costs alone
A 100 MW solar project budgeting $70,000 to $110,000 in engagement spend looks inexpensive next to a single avoided delay month at $20 million in per-MW delay exposure.
Why Amauta Treats Engagement as Project Insurance
The clearest lesson from the benchmarks above is that engagement spend is cheap relative to what it prevents. Amautapublicaffairs approaches every project the way an underwriter approaches risk: assess the community landscape, prioritize what matters most to that specific project, and refine messaging as real feedback comes in. That campaign-style discipline, built for land use, energy, and infrastructure work, is what turns a line item into protected value.

How Amauta Public Affairs Helps Quantify and Reduce Opposition Costs
Every benchmark in this article points to the same conclusion: spending on prevention early is dramatically cheaper than absorbing delay or cancellation later. Amautapublicaffairs builds that logic directly into its engagement work, running community engagement, digital advocacy, media relations, and coalition building as a single coordinated campaign rather than disconnected tasks.
That approach starts with a granular read of the local landscape, mapping stakeholders, identifying likely flashpoints, and building transparent messaging before opposition has a chance to organize. For energy and infrastructure projects specifically, Amautapublicaffairs’s digital infrastructure advocacy work applies the same benchmarks discussed above to set realistic engagement budgets against real delay risk. If you want a project-specific estimate of what opposition could cost your development and what a prevention budget should look like, review Amautapublicaffairs’s land management services and request a risk-cost assessment before your next filing deadline.
Where to Read the Primary Research
The IHRB Hidden Bill of Green Conflict report taxonomizes conflict-related costs and includes portfolio-level case examples for CFOs.
Sources
Recommended
Comments